SPXPlay Weekly Market Research
Broad Indexes Hit New Highs as Rate Bets Shift and Earnings Stay Robust
Week of August 3–August 7, 2026 · 5 market sessions · VantureCap Research · next edition expected Monday, August 17, 2026
A surprising employment contraction and downward revisions have driven traders to price in a more accommodative Federal Reserve, fueling a broad-based rally in large-cap and equal-weight indexes.
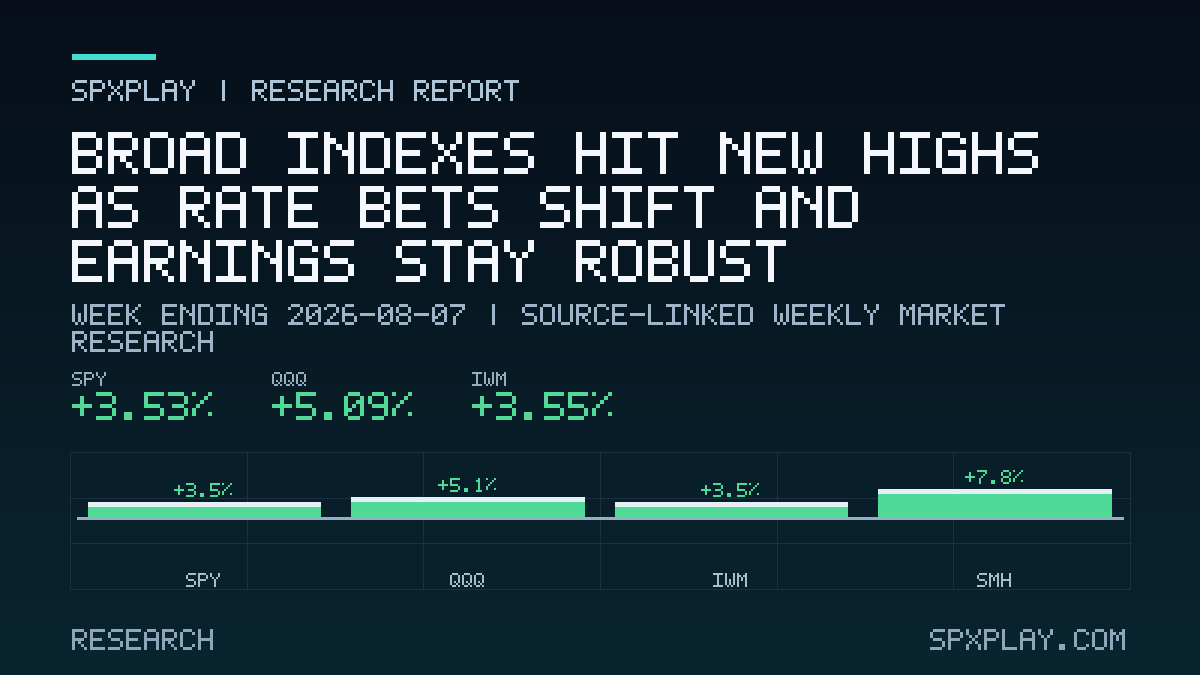
Week at a glance
| Market | Week | Close | High-low range |
|---|---|---|---|
| SPY S&P 500 proxy | +3.53% | 773.16 | +3.68% |
| RSP S&P 500 equal weight | +2.38% | 220.09 | +2.37% |
| QQQ Nasdaq-100 proxy | +5.09% | 722.89 | +6.18% |
| IWM Russell 2000 proxy | +3.55% | 301.51 | +3.64% |
| SMH Semiconductors | +7.84% | 582.92 | +11.59% |
| TLT Long Treasuries | +0.62% | 82.74 | +1.39% |
| UUP U.S. dollar | -0.37% | 28.07 | +0.48% |
| VXX VIX futures proxy | -4.60% | 20.31 | +6.17% |
Market trend across horizons
| Market | Short term | Intermediate | Long term | Long-term drawdown |
|---|---|---|---|---|
| SPY S&P 500 proxy | +2.88% Rising | +5.69% Rising | +14.13% Rising | +0.00% |
| RSP S&P 500 equal weight | +3.06% Rising | +8.13% Rising | +10.87% Rising | -0.05% |
| QQQ Nasdaq-100 proxy | -0.04% Mixed | +4.02% Rising | +21.07% Rising | -3.11% |
| IWM Russell 2000 proxy | +1.45% Mixed | +6.81% Rising | +17.79% Rising | -0.07% |
| SMH Semiconductors | -4.09% Mixed | +7.97% Mixed | +52.82% Rising | -12.78% |
| TLT Long Treasuries | -2.05% Falling | -3.40% Falling | -5.39% Falling | -8.86% |
| UUP U.S. dollar | -1.04% Mixed | +2.41% Mixed | +3.62% Mixed | -1.84% |
| VXX VIX futures proxy | -6.02% Falling | -27.15% Falling | -30.78% Falling | -48.70% |
Short, intermediate, and long-term returns are calculated from completed daily sessions. The drawdown column compares the latest close with the long-horizon closing high.
Primary trend
The S&P is in a clear uptrend across short, intermediate, and long-term horizons, with the index near its long-term high. The equal-weight S&P also rose to record territory, indicating that gains are not solely driven by a few mega-cap stocks. This broad participation supports the durability of the current advance.
Breadth and leadership
Breadth has improved, as the equal-weight index's strength suggests many stocks are participating. However, the Nasdaq and semiconductor index are lagging, showing some mixed leadership. Mega-cap earnings, particularly from Alphabet and Amazon, have contributed disproportionately to index-level earnings growth, but the market's ability to rise on broad support is a positive sign.
Trend durability
The trend could be strengthened by continued confirmation of a peak in interest rates, which would support rate-sensitive sectors and the broader market. Further upside in high-beta areas like small caps and semiconductors would signal broad risk appetite. Conversely, a resurgence in inflation or a more hawkish Fed could undermine the trend.
Sector leadership
| Market | Week | Close | High-low range |
|---|---|---|---|
| XLF Financials | +1.19% | 57.61 | +2.44% |
| XLK Technology | +7.25% | 187.96 | +9.05% |
| XLI Industrials | +3.01% | 185.16 | +4.43% |
| XLY Consumer discretionary | +3.26% | 119.82 | +2.83% |
| XLV Health care | +1.92% | 165.67 | +3.75% |
| XLE Energy | -3.44% | 57.49 | +3.85% |
| XLP Consumer staples | +0.09% | 85.12 | +3.03% |
| XLU Utilities | -1.66% | 43.60 | +3.96% |
Latest SPX and volatility context
Positioning as of the August 7, 2026 session.
This positioning block is the latest validated SPXPlay daily-analysis snapshot available to the weekly job. It is separate from the weekly close table and may be omitted when unavailable.
What drove the week
Employment Contraction Fuels Rate-Cut Hopes
A key jobs report showed an unexpected decline in nonfarm payrolls, with notable downward revisions to prior months, suggesting a rapid cooling in the labor market. This data prompted traders to significantly reduce expectations for further rate hikes.
Why it matters to SPX: A slower labor market reduces the risk of aggressive monetary tightening, which supports higher equity valuations and encourages buying in rate-sensitive sectors.
Mega-Cap Earnings Concentration Raises Vulnerability
Recent data indicates that aggregate S&P earnings growth is heavily dependent on just two mega-cap companies, Alphabet and Amazon. Excluding these firms, the index-level growth rate would be more modest.
Why it matters to SPX: The S&P's performance is increasingly tied to the fortunes of a few large AI-related firms; any negative surprises or guidance misses from these leaders could disproportionately impact the index.
Semiconductor Sector Faces Mixed Signals
The semiconductor sector showed signs of divergence: while a major foundry reported strong monthly revenue, some semiconductor ETFs saw significant outflows, and analysts warned of slowing memory pricing and rising China competition.
Why it matters to SPX: Semiconductors are a critical component of the tech-heavy S&P; any prolonged weakness in chip demand or supply chain issues could pressure the overall index, given the sector's weighting.
Geopolitical Oil Supply Risk Remains Elevated
Tensions in the Strait of Hormuz persist, with Iran stating it will not reopen the waterway unless US demands are met, and a political figure calling on oil companies to return windfall profits. These factors keep energy prices elevated and volatile.
Why it matters to SPX: Higher oil prices could squeeze consumer spending and corporate margins, while also increasing the risk of broader geopolitical conflict, which typically leads to a risk-off tone in markets.
ETF Flows Show Broad Risk-On Appetite
Investors poured significant capital into broad equity ETFs and gold, while semiconductor ETFs experienced outflows. This suggests a preference for diversified exposure over sector-specific bets.
Why it matters to SPX: Broad ETF inflows indicate strong demand for equity market exposure, which can provide a supportive backdrop for the S&P indices and ease volatility.
Futures and Bond Markets Signal Lower Rate Expectations
Following the jobs data, interest rate futures showed a reduced probability of a rate hike at the next Federal Reserve meeting. Treasury yields and the dollar declined in response.
Why it matters to SPX: Lower interest rates reduce the discount rate applied to future corporate earnings, making stocks more attractive and supporting higher price-to-earnings multiples.
Short-term risk outlook
Next-week catalyst watch
| Date | Event | Impact | Calendar |
|---|---|---|---|
| August 12, 2026 08:30 ET | CPI (Inflation) | High | BLS release calendar |
| August 13, 2026 08:30 ET | PPI (Producer Prices) | High | BLS release calendar |
| August 13, 2026 08:30 ET | Unemployment Claims | Medium | SPXPlay event calendar |
| August 14, 2026 08:30 ET | Retail Sales | Medium | SPXPlay event calendar |
| August 14, 2026 10:00 ET | Prelim UoM Consumer Sentiment | Medium | SPXPlay event calendar |
| August 14, 2026 10:00 ET | Prelim UoM Inflation Expectations | Medium | SPXPlay event calendar |
Short-term conditional scenario map
These are observation frameworks, not forecasts or trade instructions. Price confirmation and invalidation take precedence over the starting narrative.
Upside continuation
Condition: The S&P holds above its previous consolidation range and makes new highs, while the equal-weight index also continues to rise.
Confirmation: Breadth expands across sectors, and high-beta groups like small caps and semiconductors begin to outperform, while volatility remains low.
Invalidation: A breakdown below the recent consolidation low, especially on rising volatility, would signal the uptrend is at risk.
Market implication: In this scenario, investors may expect the secular bull market to persist, with potential for further gains in broad indexes, but should be mindful of overbought conditions.
Range / consolidation
Condition: The S&P oscillates between a defined support and resistance zone, with no clear breakout in either direction.
Confirmation: Trading volume dries up, and sector leadership rotates rapidly, indicating indecision between bulls and bears.
Invalidation: A sustained move above resistance or below support would end the range, leading to a new trend.
Market implication: In a range, investors might expect lower volatility and should focus on stock selection, as index returns may be muted.
Downside risk
Condition: The S&P breaks below key support, possibly triggered by a negative catalyst such as hotter inflation or a geopolitical shock.
Confirmation: Volatility spikes, Treasury yields rise, and defensive sectors outperform while cyclical and high-beta segments underperform.
Invalidation: The index quickly recovers back above the broken support level, negating the breakdown.
Market implication: A downside breakout could lead to a period of correction; investors should consider reducing exposure and increasing cash or defensive positions.
Long-term risk outlook
These source-linked risks focus on trend durability, earnings transmission, financial conditions, and structural concentration. They are not forecasts.
Structural US Shale Decline and Underinvestment
Chronic underinvestment in the global oil and gas industry, particularly in US shale, could lead to a structural supply shortage later in the decade, according to a veteran natural-resource investor. Shale wells decline quickly and require constant high spending to maintain output.
Why it matters to SPX: A sustained rise in energy prices on supply constraints would raise input costs for many S&P components, compressing margins and potentially dampening consumer spending, which would be a headwind for the broad index.
SourcesBenzinga
AI Monopoly and Pricing Power Risks
The market's earnings growth is increasingly dependent on a few mega-cap AI beneficiaries, as highlighted by data showing that Alphabet and Amazon account for most of the increase in S&P earnings. Any regulatory actions, like a bill to break up healthcare conglomerates, could also be a signal of future regulatory pressure on big tech.
Why it matters to SPX: Concentration risk means that if AI-related spending slows or if these mega-caps face regulatory headwinds, the S&P's earnings growth could disappoint, leading to de-rating and market volatility.
Global Fragmentation and Dollar Reserve Status
A top bank CEO warns that if the US loses its economic and military edge, the dollar could lose its reserve-currency status, fragmenting the global economy. This would have profound implications for financial markets.
Why it matters to SPX: A weaker dollar would complicate trade and capital flows, while global fragmentation could reduce multinational revenue growth and profitability for large S&P companies.
SourcesBenzinga
Sources and method
This report is published by VantureCap Research. Every measurement on this page — weekly changes, ranges, horizon returns, distances from average, and drawdowns — is computed deterministically by our own code from validated Alpaca daily bars, and no language model can alter those figures. The commentary around them is an original, source-linked synthesis drafted with AI assistance under editorial rules: it must cite allowlisted records and pass schema, markup, advice-language, and numeric-claim checks before publication.
The system keeps the last known-good report live when market data, source collection, model generation, validation, rendering, or archiving fails. Provider feeds and event calendars can be delayed, incomplete, or corrected. Open the cited sources and official calendars for primary context.
Read the full weekly research methodology · Subscribe by RSS
Source-linked educational market research. Not investment advice, a trade alert, or a real-time quote service.