Daily SPX playbook
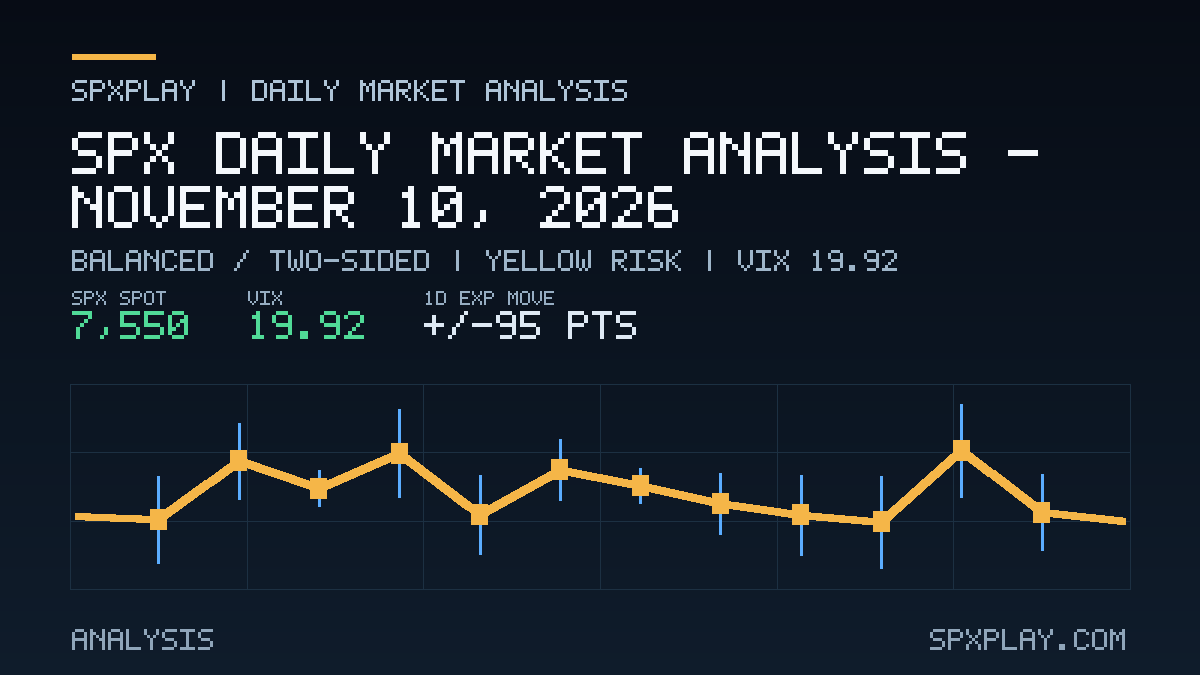
SPX Daily Market Analysis — November 10, 2026
A visual, evidence-based read of SPX trend, volatility, options positioning, important levels, and confirmation-gated defined-risk strategies.
Quick read
Balanced / two-sided. The trend stack does not show a durable directional edge. The risk stance is YELLOW: the environment argues for caution, so every idea is cut to 0.50x normal size until the tape earns more.
- VIX 19.9 elevated
- GEX unavailable: gamma regime unknown, trade as if unstable
- high-impact events near: CPI (Inflation)
- momentum reversal flag
Need the catalyst context?
Read today’s source-linked SPX Market News to see what moved the tape before applying this conditional plan.
This is a conditional read, not a prediction. Direction matters only after price accepts or rejects the levels below; an invalidation overrides the initial lean.
Trend and volatility evidence
SPX is referenced at 7,549.94 from Eod Close (2026-11-09). It sits 1.4% below its 20-day average and 1.7% below its 50-day — the burden of proof is with buyers, and rallies into those averages are tests, not confirmations. Realized 20-day volatility is 19.6%; 14-day average true range is 106.3 points (1.4% of spot).
VIX at 19.92 keeps the Elevated label while bleeding off — -5.8% over five sessions — recent fear premium being priced back out. The one-day expected move of about 94.7 SPX points lands in line with the range the tape has actually been printing. Expected move is a volatility-derived range estimate—not a forecast or hard boundary.
Important SPX levels
These are decision zones assembled from the prior session, moving averages, implied volatility, and the latest validated options-positioning snapshot. Treat each as an area where acceptance, rejection, or a clean break can change the play.
| Reference | Level | From spot | Source | How to use it |
|---|---|---|---|---|
| 50-day average | 7,679.4 | +1.7% | Trend | Intermediate trend reference |
| 20-day average | 7,657.8 | +1.4% | Trend | Short-term trend reference |
| Expected-move upper | 7,644.6 | +1.3% | Implied volatility | One-day statistical reference, not a boundary |
| Prior high | 7,577.4 | +0.4% | Prior session | Range ceiling / acceptance test |
| Prior close | 7,549.9 | +0.0% | Prior session | Baseline reference |
| Expected-move lower | 7,455.2 | -1.3% | Implied volatility | One-day statistical reference, not a boundary |
| Prior low | 7,422.2 | -1.7% | Prior session | Range floor / acceptance test |
Strategy scorecard
Every structure stays visible—including reduced, avoided, and blocked ideas—so the page shows losing or low-conviction alternatives instead of presenting only the most attractive setup. Scores compare strategies within this run; they are not win probabilities.
Score is the playbook’s own edge tally—the sum of its signed reasons for that structure—and the verdict is a threshold on it: ≥ +2 favored · ≥ +1 ok · > −1 reduced · ≤ −1 avoid. Blocked (−9) is not a low tally but a hard veto—debit spreads are switched off outright in elevated or stressed volatility.
Call Credit Spread
Avoid- disabled by default in the GEX live policy (call credits lost -$2,245 on 30d)
Conditional guidance
No setup until the evidence changes.
Put Credit Spread
Avoid- gamma regime unknown (GEX unavailable)
- range tape still pays theta
- elevated-but-fading VIX: richer credit with vol tailwind
- reversal-risk flag: whipsaw regimes drive the credit book's left tail
- high-impact pre-open print today: wait for the release to clear
- 3-7 DTE entries hold over: PPI (Producer Prices) 2026-11-13
Conditional guidance
Short strike at least one expected move (~95 pts) under spot.
Iron Condor
Avoid- needs strong pin + calm vol
- event risk within hold window
Conditional guidance
No setup until the evidence changes.
Call Debit Spread
Blocked- VIX 19.9 (ELEVATED): debits blocked -- this single filter cut 5-day backtest losses by 87%
Conditional guidance
No setup until the evidence changes.
Put Debit Spread
Blocked- VIX 19.9 (ELEVATED): debits blocked (same elevated-VIX rule)
Conditional guidance
No setup until the evidence changes.
Confirmation-gated play map
These are hypothetical planning examples generated by the daily playbook. A trigger alone is insufficient: the listed confirmation must occur, and the listed invalidation ends the thesis. Strike references can be stale by the time you read this.
CPI (Inflation) hot → gap down → drop HOLDS
Why it is on the map: momentum continuation; direction confirmed by the tape; aligned debits are the one validated debit setup (direction-gated, not bought blind)
CPI (Inflation) hot → gap down → RECLAIMS (failed breakdown)
Why it is on the map: failed breakdown + post-event vol crush = best credit entry of the week; the flush priced the bad news
CPI (Inflation) cool → gap up → HOLDS
Why it is on the map: event risk cleared + vol crush tailwind on short premium
CPI (Inflation) cool → gap up → FADES back into range
Why it is on the map: two-sided chop without positive gamma is unownable — no trade is the trade
If / then scenario plan
If CPI (Inflation) at 08:30 ET prints (either way)
Do not position into the print. The gap direction AND whether it holds decide the trade -- see the price-action play map for the specific spread per branch.
If VIX crosses above 22 intraday
Regime break: stop opening credit spreads, tighten stops on open ones. Elevated-VIX debit blocking stays on -- being flat is a position.
If VIX fades back under 16
Calm regime restored: full playbook re-opens, including (only now) direction-aligned debits if gamma is negative.
Scheduled event risk
Today
- FOMC Member Waller Speaks — 2026-11-10 04:00 ET — Medium impact
- CPI (Inflation) — 2026-11-10 08:30 ET — High impact; forecast 0.2%; previous 0.3%
Later this week
- FOMC Member Waller Speaks — 2026-11-10 04:00 ET — Medium impact
- CPI (Inflation) — 2026-11-10 08:30 ET — High impact; forecast 0.2%; previous 0.3%
- Unemployment Claims — 2026-11-12 08:30 ET — Medium impact; forecast 194K; previous 189K
- PPI (Producer Prices) — 2026-11-13 08:30 ET — High impact; forecast 0.3%; previous 0.7%
Calendar source: live (econ_calendar fetchers) · Status: current in this run
Data quality and limitations
Run-specific caveats
- No intraday SPX bar available; using last EOD close as spot.
- Options-positioning data was unavailable for this snapshot; affected GEX fields are shown as unavailable.
- 5d/20d momentum disagree -- whipsaw/V-reversal conditions are where credit books take their largest losses (3yr OOS left tail).
- Bearish SMA stack (close < SMA20 < SMA50).
- The analysis is a snapshot, not a streaming signal. Spot may be a prior close when no validated intraday bar is available.
- GEX levels are estimates derived from an options snapshot. Dealer positioning is not directly observable, and levels can move as price, volatility, open interest, and time change.
- Expected move describes an implied distribution. Actual moves can be larger.
- Strategy labels and illustrative strikes omit fees, slippage, liquidity, tax, assignment, and individual portfolio constraints.
- No raw market rows or licensed quote surface is published on this page.
See the public methodology for how trend, volatility, levels, strategy rankings, freshness, and limitations are handled.
Or take today’s Daily Options Scenario →
Educational market commentary only. This page summarizes a point-in-time SPX playbook; it is not personalized investment advice, a trade alert, or a recommendation to buy or sell any security. Levels, volatility, positioning, and conditional strategies can become stale quickly. Confirm current prices and risk before making any decision. Options involve substantial risk, and a defined-risk spread can lose its full maximum loss.